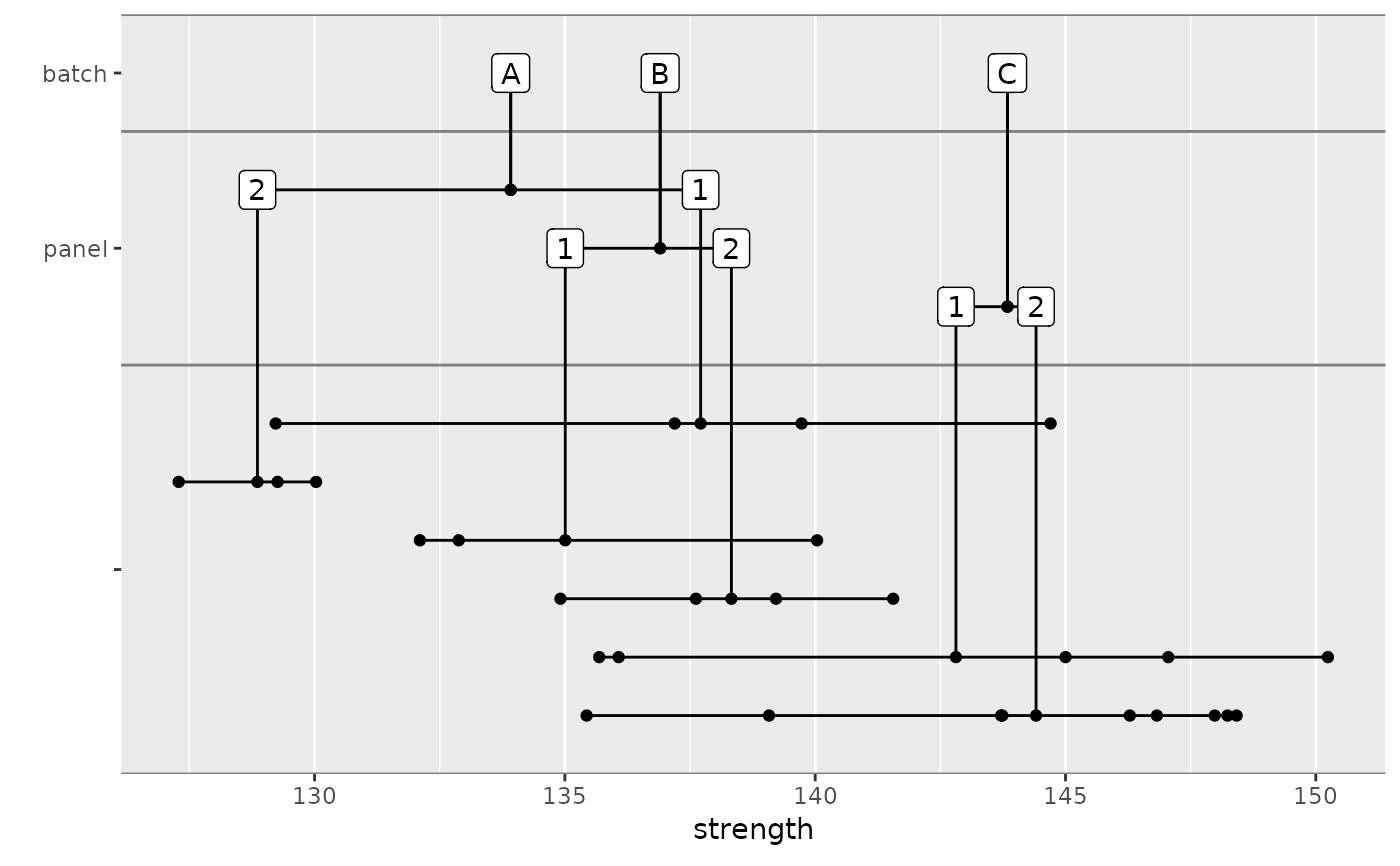
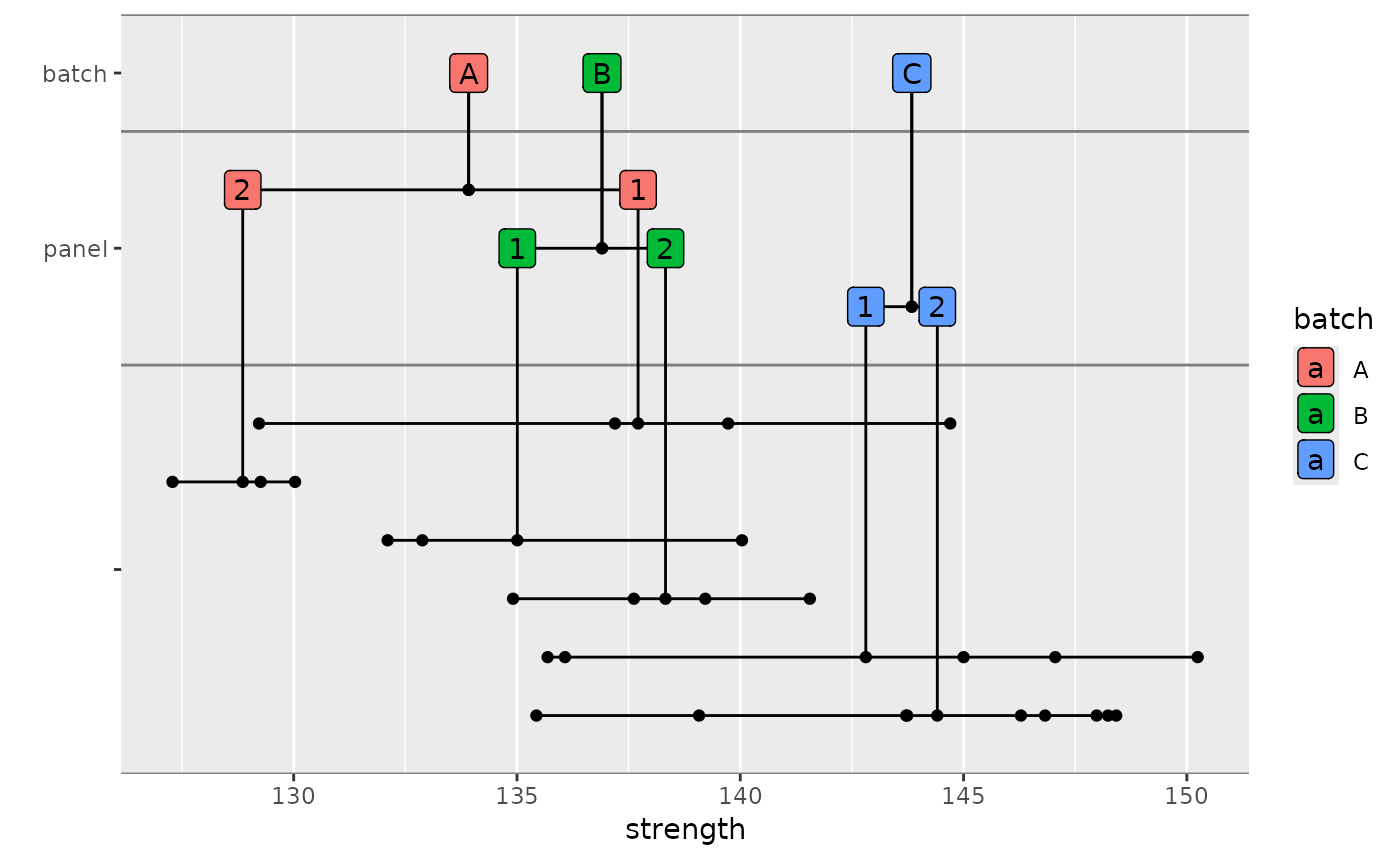
Creates a plot showing the breakdown of variation within a sample. This
function uses ggplot2 internally.
Arguments
- dat
a
data.frameor similar object- x
the variable within
datto plot. Most often this would be a strength or modulus variable.- groups
a vector of variables to group the data by
- stat
a function for computing the central location for each group. This is normally "mean" but could be "median" or another function.
- ...
extra options. See Details.
- y_gap
the vertical gap between grouping variables
- divider_color
the color of the lines between grouping variables. Or
NULLto omit these lines.- point_args
arguments to pass to ggplot2::geom_point when plotting individual data points.
- dline_args
arguments to pass to ggplot2::geom_segment when plotting the horizontal lines between data points.
- vline_args
arguments to pass to ggplot2::geom_segment when plotting vertical lines
- hline_args
arguments to pass to ggplot2::geom_segment when plotting horizontal lines connecting levels in groups
- label_args
arguments to pass to ggplot2::geom_label when plotting labels
- connector_args
arguments to pass to ggplot2::geom_point when plotting the connection between the vertical lines and the horizontal lines connecting levels in groups
Details
Extra options can be included to control aesthetic options. The following options are supported. Any (or all) can be set to a single variable in the data set.
color: Controls the color of the data points.fill: Controls the fill color of the labels. When a particular label is associated with data points with more than one level of the supplied variable, the fill is omitted.